BTC/USD Fails to Breach $21,000
Join Our Telegram channel to stay up to date on breaking news coverage
The Bitcoin price prediction action has seen a strong rally over the past weeks as the king coin fails to breach $21,000 again.
Bitcoin Prediction Statistics Data:
Bitcoin price now – $20,263
Bitcoin market cap – $397.9 billion
Bitcoin circulating supply – 19.3 million
Bitcoin total supply – 19.3 million
Bitcoin Coinmarketcap ranking – #1
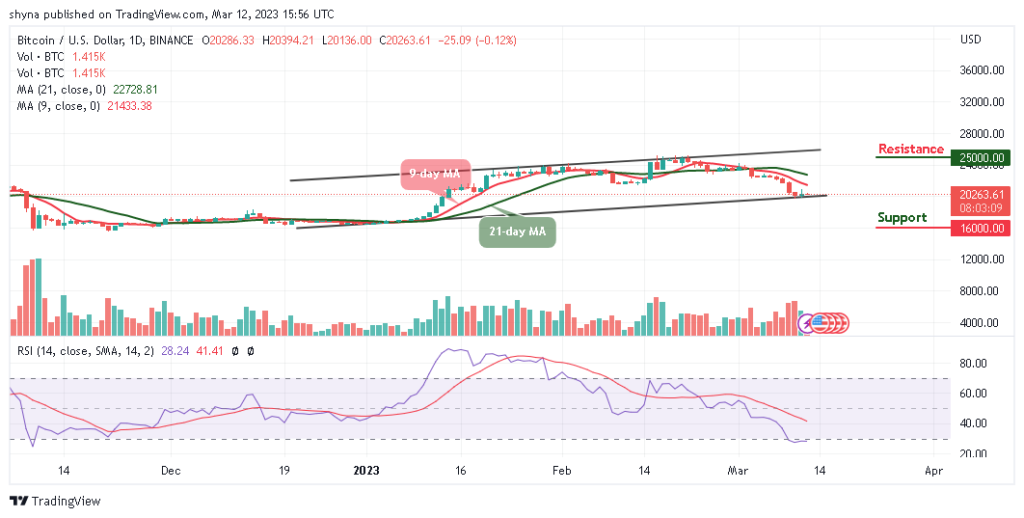
BTC/USD Long-term Trend: Ranging (Daily Chart)
Key levels:

Resistance Levels: $25,000, $27,000, $29,000
Support Levels: $16,000, $14,000, $12,000
As the daily chart indicates, BTC/USD is currently hovering at the $20,263 level. However, there have been instances when BTC has exchanged hands below $20,200 sustaining the bearish price action which is a downhill task. Meanwhile, with the look of things, the recent path of the least resistance is still bearish.
Bitcoin Price Prediction: BTC Set to Retest the Previous Low
The Relative Strength Index (14) is moving within the oversold region. Meanwhile, despite the drop suffered, the Bitcoin price is not too far from the 9-day moving average. However, the Bitcoin price may follow the downtrend should in case the king coin cross below the lower boundary of the channel.
Nevertheless, the daily chart reveals that recovery may not come easy as the support will have to be seen above the 9-day moving average and a sustainable move above this barrier could be located around $21,000 and may negate the bearish scenario which could allow for an extended recovery towards the resistance levels at $25,000, $27,000, and $29,000. However, an increase in selling pressure across the market could force the coin toward the support levels of $16,000, $14,000, and $12,000.
BTC/USD Medium-term Trend: Bearish (4H Chart)
According to the 4-hour chart, the Bitcoin price is trading within the 9-day and 21-day moving averages. BTC/USD has not been able to survive the $20,200 support as the market resumes downside momentum. However, the first digital asset is likely to return to the bear market if the price breaks below the lower boundary of the channel.
Meanwhile, the nearest support is located at $19,000, and as the technical indicator reveals, the Relative Strength Index (14) moves around the 40-level. On the other hand, if the bullish movement steps back, the resistance level of $21,000 may be visited. Moreover, BTC/USD is likely to rise to $22,500 and above if the king crosses the upper boundary of the channel.
Alternatives to Bitcoin
The Bitcoin price is likely to head toward the 9-day and 21-day moving averages; however, this is looking less and less with each failed breakout attempt as the technical indicator Relative Strength Index (14) remains within the oversold region. However, FGHT is the access token of FightOut, the Web 3.0 fitness app and gym chain that combines real-life workouts with competing in the metaverse – a global first of its kind as about $6 million has been raised so far in the ongoing presale.
Fight Out (FGHT) – Move to Earn in the Metaverse

CertiK audited & CoinSniper KYC Verified
Early Stage Presale Live Now
Earn Free Crypto & Meet Fitness Goals
LBank Labs Project
Partnered with Transak, Block Media
Staking Rewards & Bonuses
Join Our Telegram channel to stay up to date on breaking news coverage