BTC/USD Keeps Moving Around $30,500 Level
Join Our Telegram channel to stay up to date on breaking news coverage
The Bitcoin price prediction shows that BTC keeps following the sideways movement as the king coin fails to cross above the channel.
Bitcoin Prediction Statistics Data:
Bitcoin price now – $30,399
Bitcoin market cap – $586.4 billion
Bitcoin circulating supply – 19.3 million
Bitcoin total supply – 19.3 million
Bitcoin Coinmarketcap ranking – #1
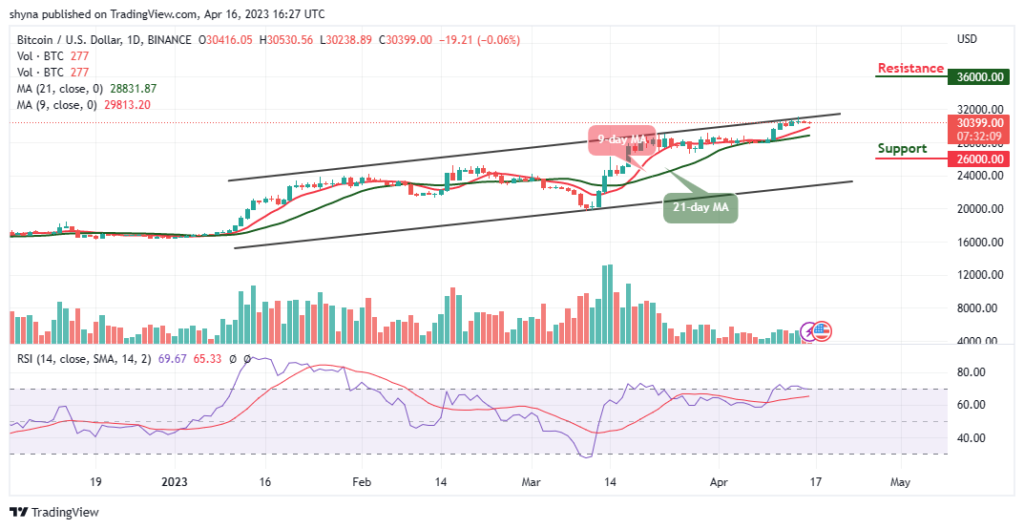
BTC/USD Long-term Trend: Bullish (Daily Chart)
Key levels:

Resistance Levels: $36,000, $38,000, $40,000
Support Levels: $26,000, $24,000, $22,000
At the time of writing, BTC/USD is bound for a spike in volatility, but there seems to be no room for further gains after experiencing upward pressure in the past few days. The Bitcoin (BTC) is currently hovering at $30,399, but it has not been able to cross above the upper boundary of the channel.
Bitcoin Price Prediction: BTC Price May Retreat to Gain Higher
Looking at the daily chart, the Bitcoin price might see further sideways price action as additional losses could play out until there is a change in the price movement. However, as the Bitcoin price ranges, the coin could rise and cross the upper boundary of the channel but if not, it could head to the downside. However, the technical indicator Relative Strength Index (14) keeps moving around the 70-level, this could mean that the king coin may gain a little before heading to the south.
From above, recovery could be set in bit by bit as the bulls may push the Bitcoin price above the resistance level of $31,000, and a sustainable movement above this level could allow for an extended recovery in the direction of the potential resistance levels at $36,000, $38,000, and $40,000. On the downside, any bearish movement below the 9-day and 21-day moving averages may cause the Bitcoin price to hit the supports at $26,000, $24,000, and $22,000.
BTC/USD Medium-term Trend: Ranging (4H Chart)
According to the 4-hour chart, the Bitcoin price is hovering within the moving averages. BTC/USD may head toward the upper boundary of the channel as the market moves sideways. However, if the price crosses above the channel, it could locate the resistance level of $32,000 and above.
Nevertheless, if the bearish movement resumes, the Bitcoin price may head toward the lower boundary of the channel and could touch the support level of $29,000 and below. Nevertheless, the technical indicator Relative Strength Index (14) could slide below the 50-level to confirm the bearish movement.
Alternatives to Bitcoin
The Bitcoin price has been trading below the $31,000 resistance area for the few days as the current uptrend remains stationary. Meanwhile, if buyers manage to keep the price above the $30,500 resistance and the bullish momentum is maintained, the current uptrend will resume. On that note, to vote in polls, all Love Hate Inu participants must stake their tokens. It’s a 30-day minimum stake before you can vote. With this staking mechanism, spam and manipulation are controlled. On top of that, the process is anonymous, so you don’t have to be concerned about being judged or bullied if you express your opinion. However, the LHINU token has raised close the $4.5 million in the ongoing presale.
Love Hate Inu – Newest Meme Coin

Decentralized Polling – Vote to Earn
Early Access Presale Live Now
Ethereum Chain
Featured in Yahoo Finance
Mint Memes of Survey Results as NFTs
Staking Rewards
Viral Potential, Growing Community
Join Our Telegram channel to stay up to date on breaking news coverage