
BTC/USD May Retrace Above $45,000

Bitcoin Price Prediction – March 26
The Bitcoin price rebounds from the early dip at $44,091 as the buying interest may increase on approach to $45,000.
BTC/USD Long-term Trend: Ranging (Daily Chart)
Key levels:
Resistance Levels: $50,000, $52,000, $54,000

Support Levels: $40,000, $38,000, $36,000
BTC/USD is ranging as the market may establish a cross above $45,000 but currently rebounding to retest previous resistance at $44,500. The buyers may continue to look for some resistance levels above the 9-day and 21-day moving averages on its way to the upper boundary of the channel and the path of least resistance appears to the upside in the near term amid a favorable bullish technical setup.
Bitcoin Price Prediction: BTC Price May Reclaim $45,000 Resistance
In the past few hours, after the Bitcoin price touches the daily low of $44,091, the king coin is now facing the resistance level of $44,500 and looking forward to reclaiming the resistance level of $45,000. However, the daily chart reveals that if the 9-day moving average remains above the 21-day moving average, this will continue to confirm the next direction that the coin will follow. In other words, BTC/USD may decline if the $44,000 support breaks down, but the price could rise if the $45,000 resistance is reached.
At the time of writing, the technical indicator Relative Strength Index (14) may stay above 60-level to indicate a bullish movement. Therefore, if the Bitcoin price stays above the 9-day and 21-day moving averages, it could hit the resistance levels of $50,000, $52,000, and $54,000 but any movement below the 9-day and 21-day moving averages could hit the supports at $40,000, $38,000, and $36,000.

BTC/USD Medium-Term Trend: Bullish (4H Chart)
According to the 4-hour chart, the Bitcoin price is seen sliding below the 9-day moving average as the technical indicator Relative Strength Index moves below 70-level. From above, if the Bitcoin price moves above the 9-day and 21-day moving averages, the bullish influence could spike and the accrued gains massively.
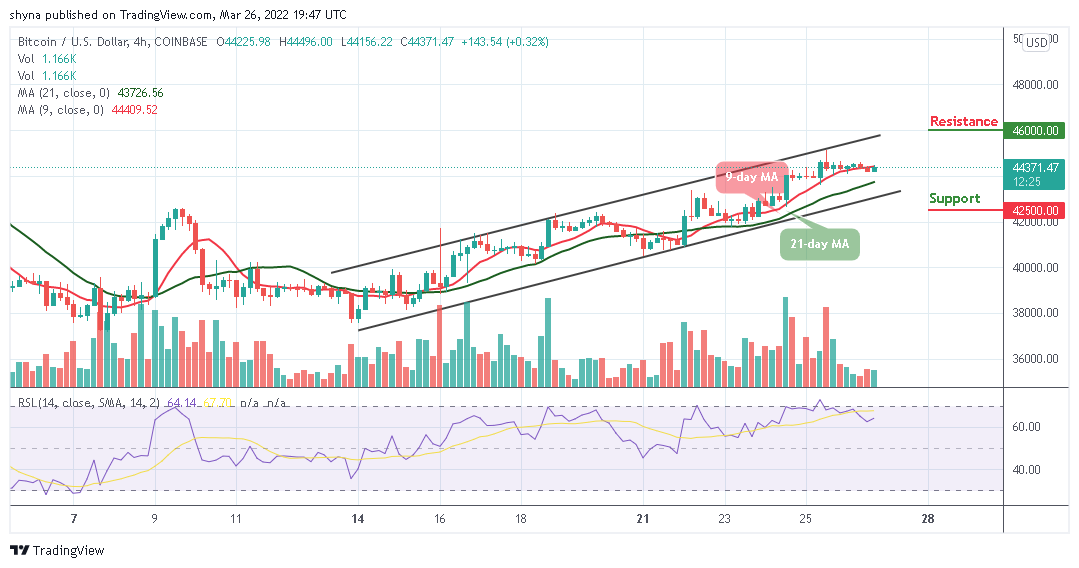
However, the current candle could fail to move towards the upper boundary of the channel, and the critical support level remains at $42,500 and below, but the best the bulls can do is to hold above the resistance level of $45,000 and keep their attention on breaking the potential resistance at $46,000 and above.
Looking to buy or trade Bitcoin (BTC) now? Invest at eToro!
68% of retail investor accounts lose money when trading CFDs with this provider
Read more: