Top Techniques Profitable Traders Use

As one of the leading cryptocurrencies in the market, Ethereum has captured the attention of investors and traders. Understanding the price analysis techniques of Ethereum can offer significant insights and improve decision-making in the rapidly changing crypto market.
Multiple factors influence Ethereum’s price, and top techniques can be employed to analyze its price movement.
A Brief History of Ethereum
Ethereum was conceived by programmer Vitalik Buterin in 2013 and officially launched in 2015. Its primary innovation is its ability to support the creation and execution of smart contracts and decentralized applications (dApps) on its network.
These capabilities have made Ethereum a popular choice for developers, leading to the growth of its ecosystem and the increasing adoption of its native crypto, Ether (ETH).

ETH is utilized as the gas or fuel to power transactions, execute smart contracts, and run dApps on the Ethereum network. Over the years, Ethereum has solidified its position as the second-largest crypto by market capitalization, with a vibrant community of developers and users.
Understanding the Factors Affecting Ethereum’s Price
Ethereum’s price is influenced by a multitude of factors that can lead to price fluctuations. Some of the key factors include:
Market demand: The supply and demand for Ether in the market can significantly impact its price. Factors like increased adoption, growing use cases, and rising interest from institutional investors can drive demand and, consequently, the price.
Regulatory changes: Regulatory decisions and changes in government policies towards cryptocurrencies can affect Ethereum’s price. Favorable regulations encourage adoption, while restrictive policies lead to decreased demand.
Technological advancements: Improvements and upgrades to the network, such as the transition from Ethereum 1.0 to Ethereum 2.0, can impact the price by affecting its scalability, security, and efficiency.
Macroeconomic events: Global economic events, such as financial crises or political instability, can influence investor sentiment and cause price fluctuations in the cryptocurrency market, including Ethereum.
Top Techniques for Ethereum Price Analysis
Ethereum price analysis can be approached using three primary techniques. These include fundamental analysis, technical analysis, and sentiment analysis.
Each technique provides distinct insights, and a comprehensive analysis can be achieved by employing all three.
Fundamental Analysis
Fundamental analysis evaluates Ethereum’s intrinsic value by examining various factors, including:
Technology: Evaluating the underlying blockchain technology, its efficiency, security, and potential for future development can provide insights into Ethereum’s long-term prospects.
Development progress: Assessing the progress of ongoing projects, upgrades, and improvements to the Ethereum network can indicate its potential for growth and adoption.
Real-world use cases: Analyzing the current and potential applications of Ethereum in various industries can help determine its long-term value and demand.
Technical Analysis
Technical analysis employs historical price data and indicators to identify patterns, trends, and potential price movements.
Some popular technical analysis tools for Ethereum include:
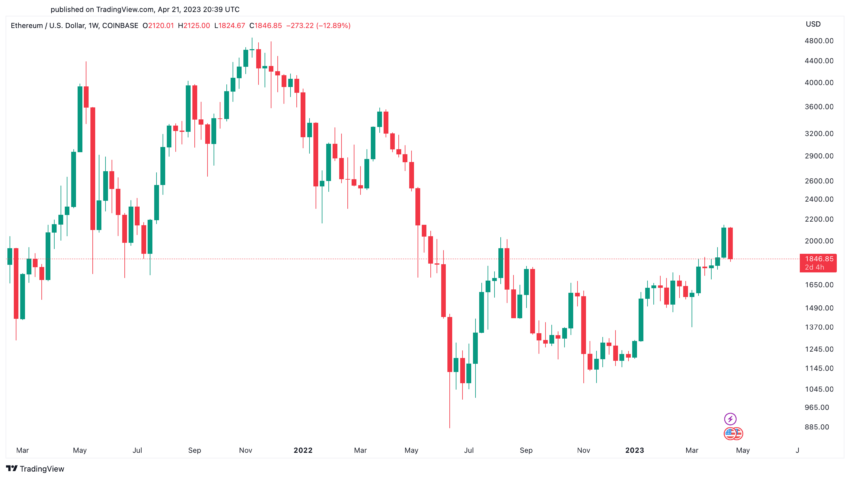
Price Charts
Line charts plot the closing price for each time period, connecting the data points with a line.
Bar charts use vertical bars to represent the high, low, open, and close prices for each time period.
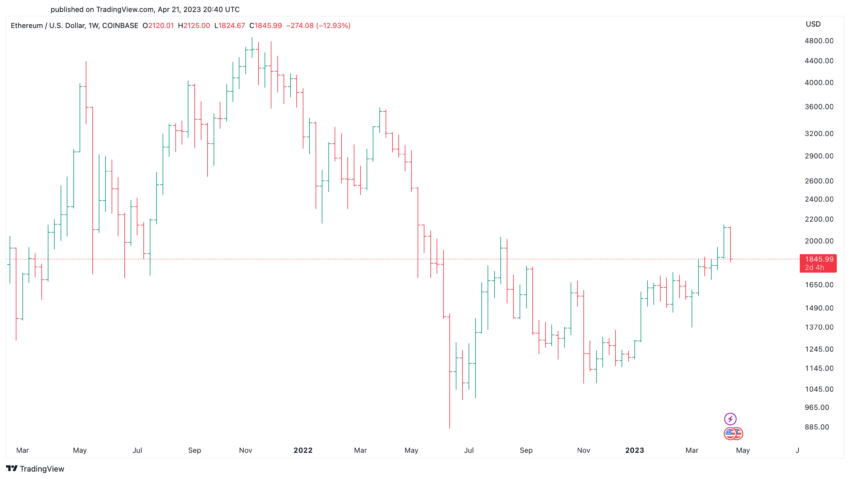
On the other hand, candlestick charts display the same information as bar charts but use color-coded candlestick shapes to provide a more visually appealing representation of price movement.
Moving Averages
Simple moving averages (SMA) are calculated by averaging a security’s closing prices over a specified period.
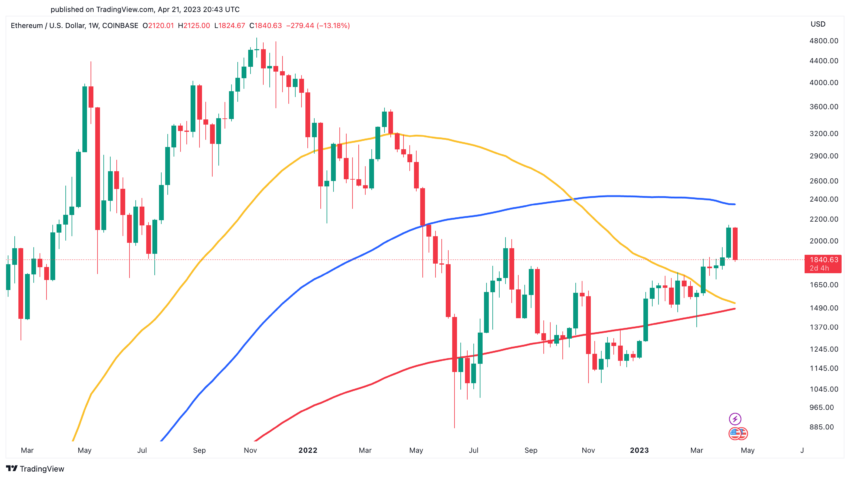
The exponential moving average (EMA) gives more weight to recent prices, making it more responsive to new information.
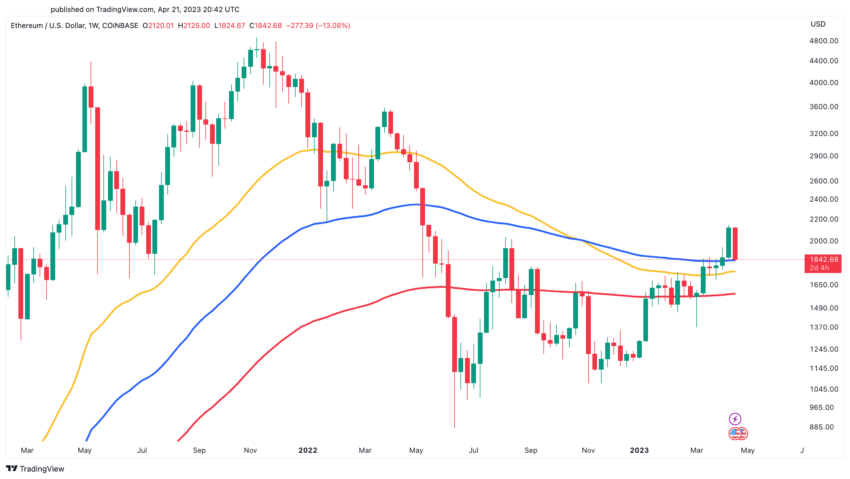
Both types of moving averages help identify trends by smoothing out price fluctuations.
Support and Resistance
Support levels represent price points where buying pressure is expected to overcome selling pressure, causing the price to bounce back upward.
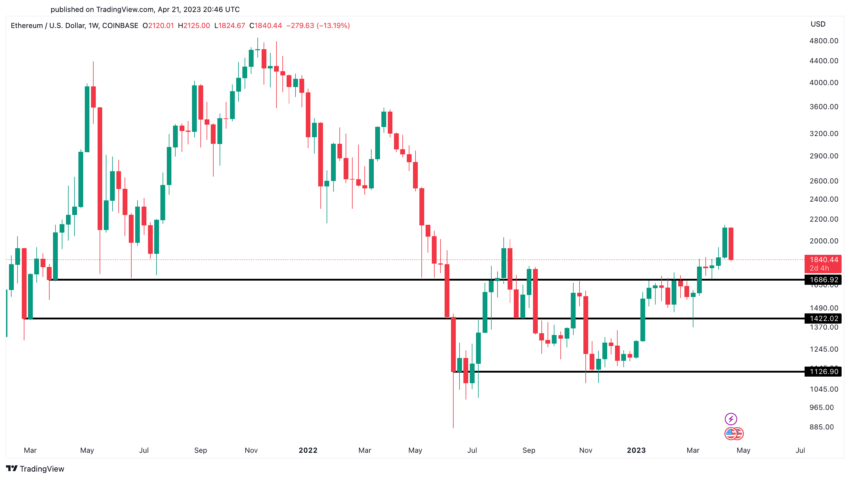
However, resistance levels are price points where selling pressure is expected to overcome buying pressure. This causes the price to reverse downward.
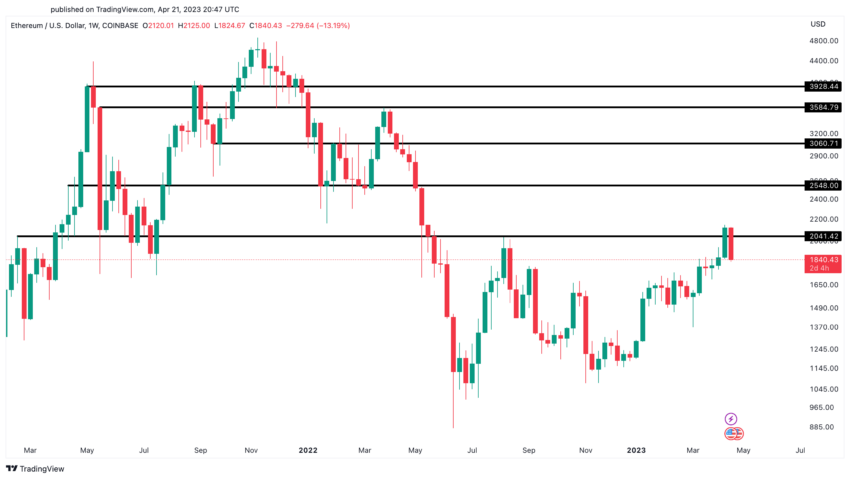
Identifying these levels can help traders make better decisions on when to enter or exit a trade.
Fibonacci Retracements
Fibonacci retracements are based on the Fibonacci sequence, a series of numbers where each number is the sum of the two preceding ones (0, 1, 1, 2, 3, 5, 8, etc.).
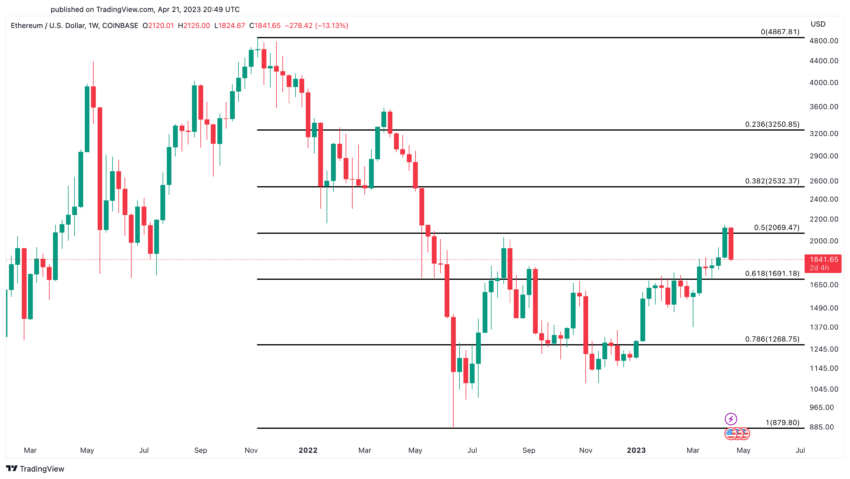
In technical analysis, Fibonacci retracements are used to identify potential support and resistance levels during a price trend. They divide the vertical distance between a high and a low by key Fibonacci ratios (23.6%, 38.2%, 50%, 61.8%, and 100%).
Relative Strength Index (RSI)
The RSI is a momentum oscillator that measures the speed and change of price movements on a scale of 0 to 100.
Generally, an RSI above 70 indicates that an asset is overbought (potentially overvalued). Meanwhile, an RSI below 30 signals that it is oversold (potentially undervalued).
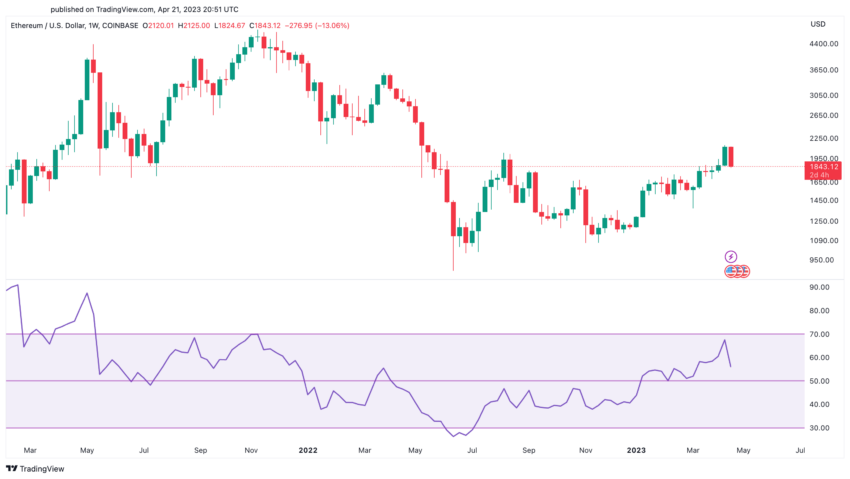
This can help traders identify potential buying or selling opportunities.
Bollinger Bands
Bollinger Bands consist of three lines: a simple moving average (middle band) and two standard deviations above and below the middle band (upper and lower bands).
When the bands contract, it indicates low volatility. Conversely, when they expand, it indicates high volatility.
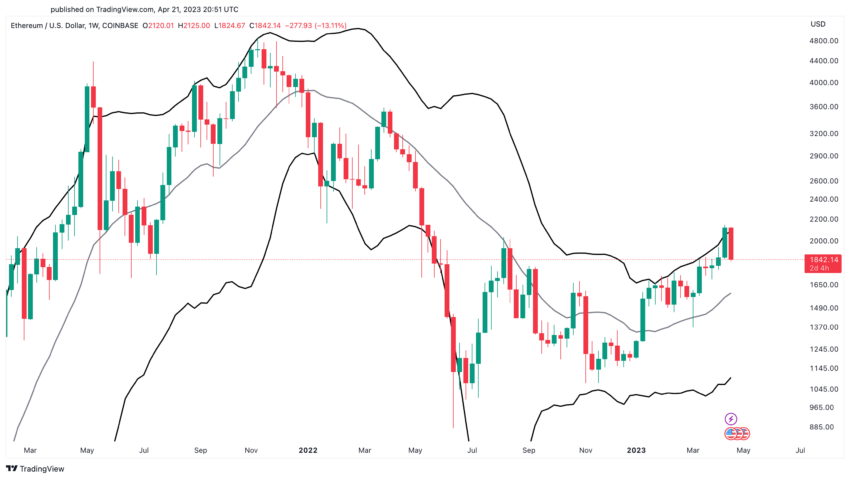
Bollinger Bands can also help identify potential reversals when prices touch or move beyond the bands.
MACD (Moving Average Convergence Divergence)
The MACD consists of two lines. One is the MACD line, which is the difference between two exponential moving averages (usually 12-day and 26-day EMAs). And the second is the signal line, which is an EMA of the MACD line (usually a 9-day EMA).
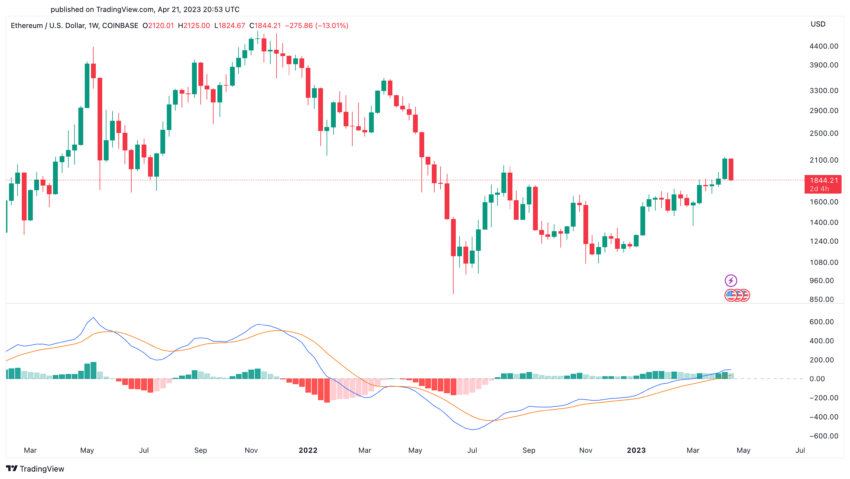
When the MACD line crosses above the signal line, it indicates a bullish signal. Conversely, when it crosses below, it indicates a bearish signal.
Ichimoku Cloud
The Ichimoku Cloud consists of five lines: the conversion line, the baseline, the leading span A, the leading span B, and the lagging span.
These lines help identify trends, support and resistance levels, and potential entry and exit points.
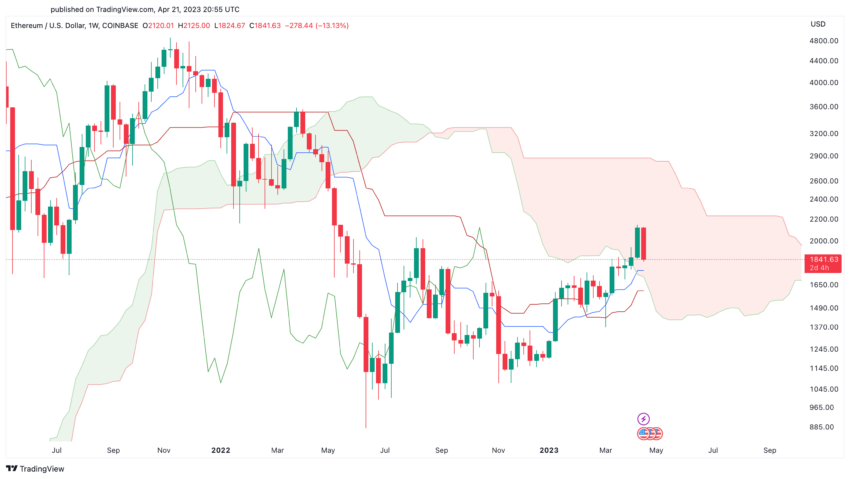
When the price is above the cloud, it indicates a bullish trend. But when it’s below the cloud, it signals a bearish trend. The cloud itself acts as a support or resistance area, depending on the price’s position relative to it.
Elliott Wave Theory
The Elliott Wave Theory suggests that market prices move in recurring wave patterns consisting of five waves in the direction of the main trend (impulse waves) and three corrective waves against the trend (corrective waves).
These patterns can occur in various time frames, from intraday to multi-year cycles.
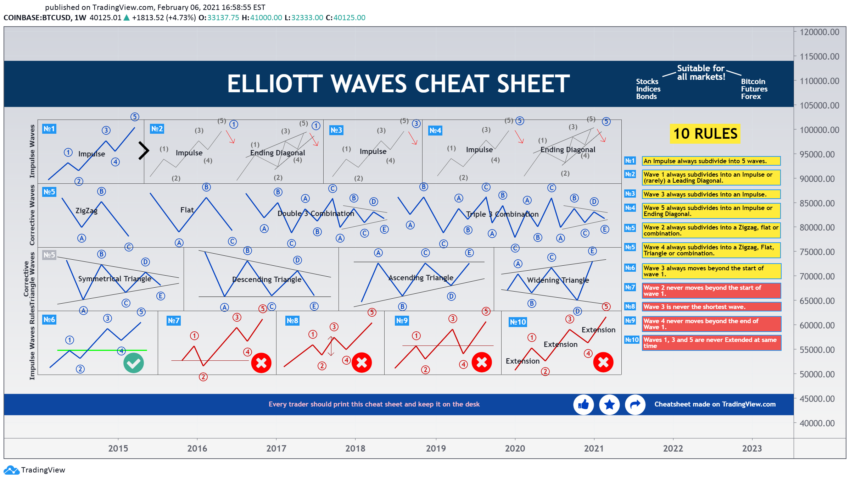
Understanding the structure of these waves can help traders identify potential trend reversals and continuation patterns, leading to better trading decisions.
Summing All Up
Ethereum price analysis is a complex process that requires a solid understanding of various techniques, including fundamental, technical, and sentiment analysis.
By mastering these techniques and using them in conjunction, you can better understand Ethereum’s price movements and make more informed decisions when trading or investing in this popular cryptocurrency.
FAQs
Ethereum is an open-source, decentralized platform that enables the creation and execution of smart contracts and decentralized applications (dApps). Its native cryptocurrency, Ether (ETH), is used as the fuel for these applications.
Factors affecting Ethereum’s price include market demand, regulatory changes, technological advancements, and macroeconomic events.
Fundamental analysis focuses on intrinsic value, technical analysis uses historical price data to identify patterns and trends, and sentiment analysis examines the emotions and opinions of market participants.
Popular tools include price charts, moving averages, support and resistance levels, Fibonacci retracements, RSI, Bollinger Bands, MACD, Ichimoku Cloud, and Elliott Wave Theory.
By understanding and applying these techniques, you can identify trends, potential reversals, and entry and exit points, which can help you make informed decisions when trading or investing in Ethereum.
Disclaimer
In line with the Trust Project guidelines, this price analysis article is for informational purposes only and should not be considered financial or investment advice. BeInCrypto is committed to accurate, unbiased reporting, but market conditions are subject to change without notice. Always conduct your own research and consult with a professional before making any financial decisions.